While Hollywood and Silicon Valley love the limelight, California is an agricultural powerhouse, too. Agricultural products sold in the Golden State totaled $59 billion in 2022. But rising temperatures, declining precipitation and decades of over pumping may require drastic changes to farming. Legislation to address the problem could even see fields taken out of cultivation.
Fortunately, a study out of UC Santa Barbara suggests less extreme measures could help address California’s water issues. Researchers combined remote sensing, big data and machine learning to estimate how much water crops use in the state’s Central Valley. The results, published in Nature Communications, suggest that variation in efficiency due to farming practices could save as much water as switching crops or fallowing fields.
“There’s an opportunity for less obtrusive methods of saving water to be more important than we originally thought,” said lead author Anna Boser, a doctoral student at UCSB’s Bren School of Environmental Science & Management. “So we might not have to make as many changes in land use as we originally thought.”
California’s fertile soils and Mediterranean climate enable farmers to cultivate high-value crops that just aren’t viable in the rest of the country. Over a third of the country’s vegetables, and nearly three-quarters of fruits and nuts, are grown in California, according to the state’s Department of Food and Agriculture.
But many of these crops are quite thirsty. Agriculture accounts for around 80% of water used in California, explained co-author Kelly Caylor, a professor at the Bren School. “Declining groundwater levels and a changing climate put pressure on the availability of irrigation water, making it critical to determine how we can ‘do more with less.’”
In 2014, Sacramento passed the Sustainable Groundwater Management Act (SGMA) to secure California’s water resources. SGMA mandates that every groundwater basin in the state must be sustainable by 2040. Each basin created a local agency tasked with developing a plan to meet this goal. Mostly, that means ensuring that we don’t pump more water out of the ground than what seeps in. We will need to reduce total groundwater use by 20% to 50% by 2040, depending on the basin, Boser said. But to accomplish this, we need an idea of how much water farms use, and what fraction of that actually makes it to crops.
Modeling water use
Scientists have a variety of methods to estimate the amount of water ascending from the Earth’s surface to the atmosphere due to evaporation and transpiration through plant leaves. Notably, evaporation cools things down. “When we get hot, we sweat to cool off. The Earth does something similar,” Boser said. Scientists look at how warm the ground is and see how much energy it’s getting from sunlight and the atmosphere. If the ground is cooler than expected, it means some of that energy was used to turn water into vapor, which cools down that spot.
An evapotranspiration database called OpenET became publicly available in early 2023. It provides satellite-based evapotranspiration estimates for the western United States. But Boser was interested in the water being used specifically by crops. So, she compared transpiration in fallowed fields to active fields across the Central Valley. Subtracting evapotranspiration in fallow fields from total evapotranspiration yields the amount of water that crops are actually consuming.
Unfortunately for Boser, farmers don’t fallow fields randomly. Often they’ll take their lowest-yielding fields out of production. That creates systematic differences between fallowed and cultivated fields, which could skew Boser’s analysis. So, she created a machine-learning model to conduct a weighted comparison between active and fallowed land, accounting for factors like location, topography and soil quality.
She trained the model on 60% of the areas and tested its results on 30%, fine tuning the algorithm until its predictions matched the actual conditions in these fields within 10 milliliters per square meter per day, on average. Now confident in her model, she applied it to the rest of California’s Central Valley.
Encouraging results
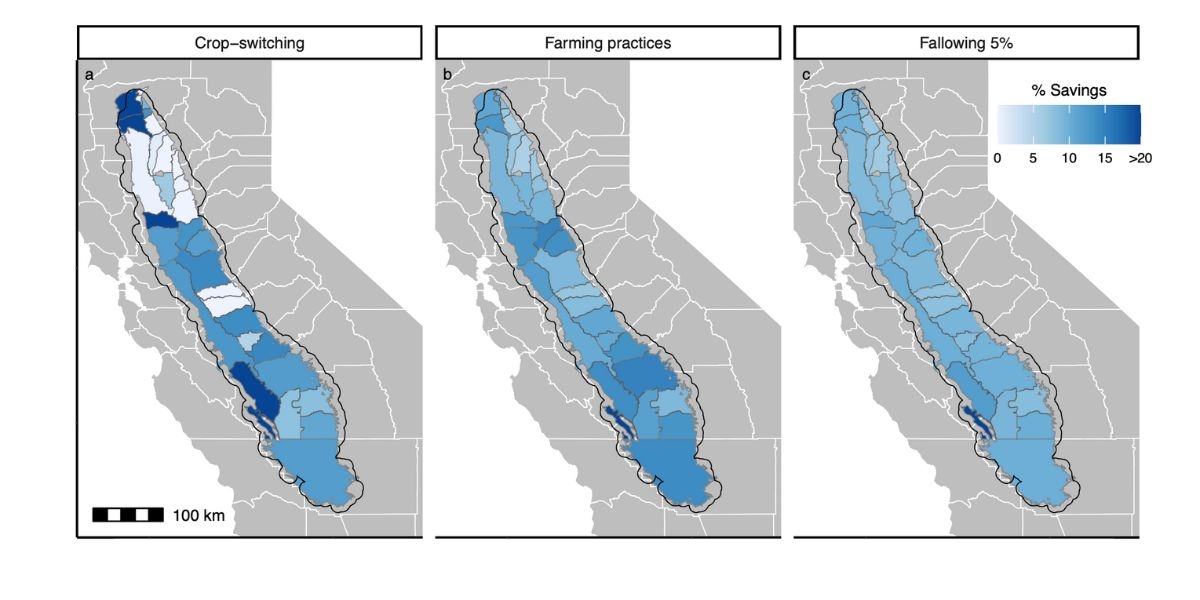
Crop type only explained 34% of the variation in water consumption. “What that means is maybe we’re overlooking some other ways that we could save water,” Boser said. She continued to investigate the model, controlling for factors like location, topography, local climate, soil quality and orchard age (when applicable). Ultimately, a full 10% of crop transpiration could be saved if the top 50% of water users reduced their water consumption to match that of their median-consuming neighbors. Boser attributes these savings to differences in “farming practices.”
Now, 10% might not sound like a lot, but it’s comparable to a number of other interventions. The authors also estimated the effect of switching crops. If the same 50% of farmers switched to the median water-intensive crops for their area, agricultural evapotranspiration would drop by 10%.
Meanwhile, if the state took the top 5% most water-hungry fields out of production, the model says agricultural evapotranspiration would drop by, you guessed it: 10%. This suggests that addressing inefficiencies in farming practices could save as much water as switching crops or taking fields out of cultivation.

To be fair, the results from fallowing would affect only 5% of cultivated land, as opposed to 50% for crop changes and improved farming practices. “We’re probably going to have to fall back on fallowing at least a little bit,” Boser said, “but hopefully not as much as we were originally expecting.”
The authors want to figure out what practices farmers are using that account for the 10% differences in crop water usage. Some examples include mulching, no-till planting, using drought-tolerant varietals, and deficit irrigation — where you provide less water than the crop could theoretically consume. Deficit irrigation already yields good results in viticulture, where vintners find it can improve the quality of wine.
Changing irrigation practices could also help reduce water use. Irrigation efficiency accounts for the fraction of water a farm uses that actually gets consumed by crops. Inefficiencies include leakage, weed growth and evaporation in transport and in the field. These weren’t within the scope of Boser’s model, which only considers transpiration by the crops themselves. Inefficiencies happen before the water even gets to the plants.
According to Boser, up to 60% of the water a farm uses actually passes through the roots of its crops. Clearly there’s plenty of potential gains in this area, though it isn’t clear what efficiency is actually attainable, she said. “Irrigation efficiency is actually quite poorly understood.”
Better characterizing this is on the team’s to-do list. They hope to identify the causes of irrigation inefficiencies, quantify the efficiencies of different types of irrigation, and learn how climate and geography affects irrigation efficiency. All this will require collecting empirical data.
California is at a critical crossroads in water management. For the first time in its history, the state is putting in place regulations that require substantial reductions in groundwater extraction, including in regions where livelihoods depend on thirsty agricultural production.
“This paper uses novel, data-driven methods to show that, contrary to popular belief, there is large potential to cut water use in California agriculture without fallowing fields,” said co-author Tamma Carleton, an assistant professor at UCSB’s Bren School. “This raises the possibility that the state can continue its role as an agricultural powerhouse while also sustainably managing an essential natural resource.”
Harrison Tasoff
Science Writer
(805) 893-7220
harrisontasoff@ucsb.edu


