New Tool Exploits Unique Structure of Links Between Patents
Sizing up the competition has gone high-tech. With new patent-mapping technology that compares industries, countries or entire technological fields, decision-makers have a new tool at their fingertips as they develop policies on economic or scientific technology, innovation or investment.
“We can make maps for different time periods and then see whether new areas of patenting are emerging or develop forecasts to see what kinds of technologies may be up and coming,” said Luciano Kay, a postdoctoral fellow at UC Santa Barbara’s Center for Nanotechnology in Society.
“The maps can also be used to examine performance, particularly from the policy perspective, and our overlay technique supports competitive intelligence and policy decision-making,” he continued. “For example, our maps can reveal relatively unexplored technological areas or highlight denser areas with more technological interdependency, which may be the ground where future technology applications emerge.”
Kay and colleagues started this patent mapping project at the Georgia Institute of Technology, where Kay earned his Ph.D. in public policy. He has continued working on this project in his position at UCSB.
The team drew on the idea of scientograms — graphic representations that depict the state of science in a specific domain — to develop the methodology. Their findings will appear in a forthcoming issue of the Journal of the American Society for Information Science and Technology.
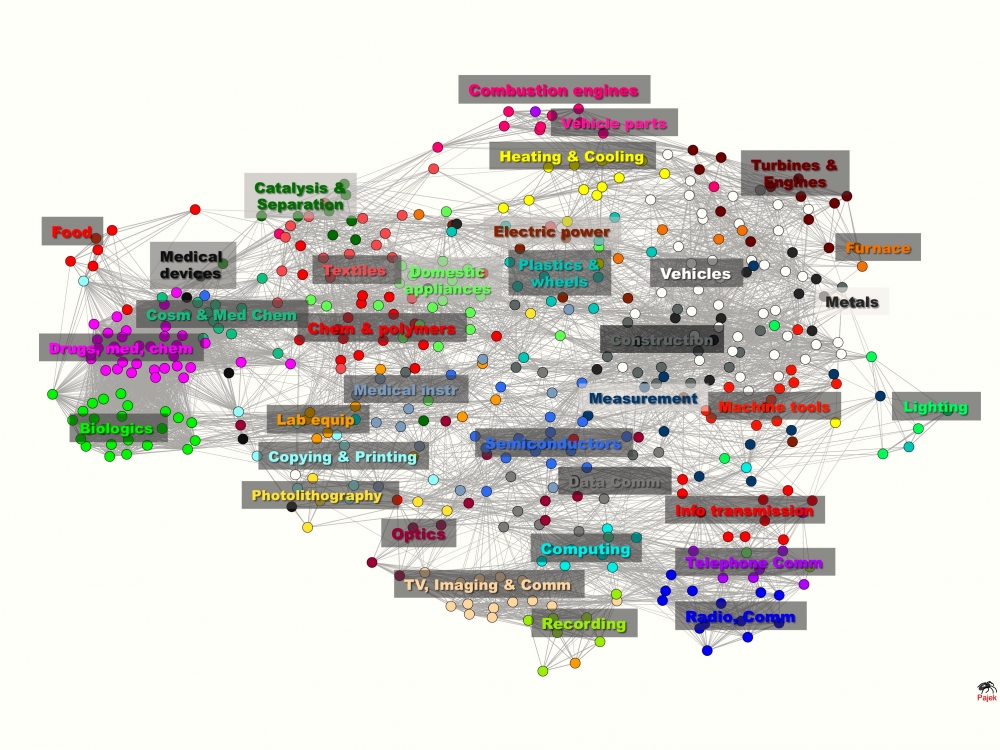
The team decided to develop a new global patent map that provides improved representation of technology-intensive categories as well as a method to locate the patent data of individual organizations and technological fields on the global map. Their work creates patent maps based on citations rather than the co-occurrence of classifications. It also introduces an overlay map technique that locates the relative technological position of an organization’s or a country’s patent activity.
The researchers used European Patent Office data from 2000 to 2006 to visualize similarities in citing-to-cited relationships between categories of the International Patent Classification (IPC). This patent dataset, extracted from the PatStat database, represents more than 760,000 records in 466 IPC categories.
“Those classifications of patents usually fall into the function or purpose of the technology,” Kay explained. “But those classifications don’t tell you anything about how closely related the technologies are. So you need the kind of maps we’ve developed to understand that.
“Patent documents have more than one IPC class because the technology usually relates to more than one of those broad categories, such as physics or chemistry, for example,” he continued. “That’s why other maps use the co-occurrences of IPC classes to draw visualizations and connect them. What we use instead are the citations included in the patent record.”
The methodology developed by Kay’s group assigns a link between two patents if one cites another and then classifies patents into 35 broad categories of closely related IPC technologies. The more links between patents, the shorter the “technological distance” between them. The study also shows that similar technologies based on citing-to-cited patterns — and therefore close on the global patent map — are not necessarily in the same hierarchical IPC branch of the standard formal classification.
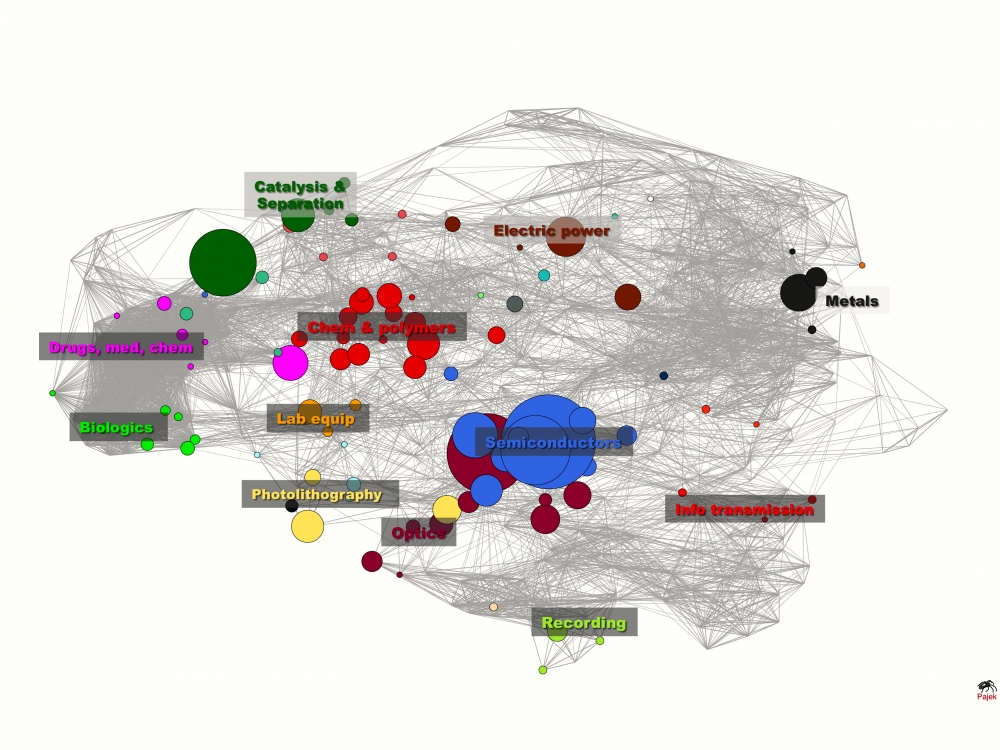
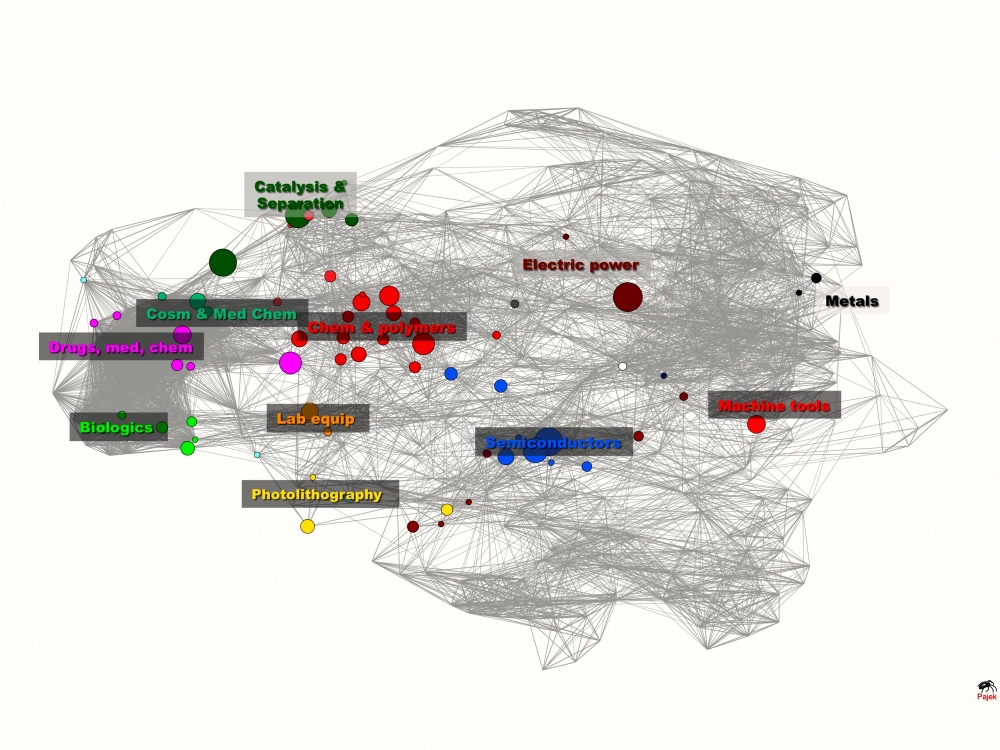
To demonstrate this, the paper uses an overlay of the nanotechnology-related patenting activities of two companies, Samsung and DuPont, and two different nanotechnology subfields, nano-biosensors and graphene (a two-dimensional crystalline chemical element), on the global patent map. This unique map shows both the technological areas in which these companies have been working and the technologies they are ignoring. Kay says that sorting by various technologies not only demonstrates how different areas of technology are related — sometimes in unexpected ways — but also how new topics are emerging.
Right now, this new approach to patent mapping largely confers benefits on governments and large companies that can use these tools to gain intelligence about the strengths and weaknesses of their competitors. According to Kay, the maps in the study cover a specific time frame, but one next step might be to look at how the maps evolve over time.
In addition to Kay, the research team included Jan Youtie, director of policy research services in Georgia Tech’s Enterprise Innovation Institute; principal investigator Alan Porter, professor emeritus at Georgia Tech’s Schools of Industrial & Systems Engineering and Public Policy; Ismael Rafols of Universitat Politècnica de València in Spain; and Nils Newman of Intelligent Information Services Corp.
This research was conducted primarily at Georgia Tech, supported by the National Science Foundation through the Center for Nanotechnology in Society at Arizona State University. The research was undertaken in collaboration with UCSB’s Center for Nanotechnology in Society.


